Now booking In partnership with cynkra, AthlyticZ presents blockr
Build a no-code analysis board in R, over two afternoons.
You write five blockr blocks, wire them into a board, and put your own data behind it. Two sessions of three hours, six hours in total, built live on a stage of the Tour de France Femmes.
This cohort runs with eight or more registrations. If it does not fill, you are refunded in full.
Early rate through September 10, then $399. Two cohorts, two sessions each, and it is a live build with David rather than a recording.
Schematic. Ours, drawn for this page: the climbs are categorized but deliberately unnamed and the elevations are invented, because a drawing should not be mistaken for a reading. The distance, the eight categorized climbs, the ascent and the snapshot count above are the real ones.
Five blocks you wrote, wired into a working board.
Not five blocks you watched somebody write. You write them, against your own data, and the board is running when you leave.
One call returns the pack's position now and forgets it. The block keeps every answer, so the stage can be read after it has finished.
rider_id  time      lat       lon      speed
  14      14:02:30  44.9121   6.4034   41.2
  22      14:02:30  44.9118   6.4029   41.0
Straight lines between checkpoints cut through the hillside. Rebuilding the road from where the riders actually went is what makes the climbs appear.
km     elev_m   grade
 92.4   1174     6.8%
 92.9   1208     6.9%
A crash is not in position data. It is a gap that opens for no reason, and the commentary is the only record of why.
time      note
14:31:00  crash, 3 riders, km 88
14:47:00  abandon, rider 22
Who is with whom, and how far back. This is the number a viewer actually wants and the one nobody publishes.
time      group  n   gap_s
14:40:00  lead    6   0
14:40:00  chase  14   38
Somebody who does not write R opens it, drives it, and reads it without you in the room.
[ stage board ]  climbs | gaps | groups | radio
  driven by whoever opens it
Pick any block above and it shows what it hands to the next one. That handover is the whole idea: you write five small things, wire them together, and the board is the result.
- 01fetch
Live positions
Polls the race feed on a fixed clock and keeps every snapshot, because the endpoint does not.
you write this one - 02clean
Road profile
Rebuilds the road from rider GPS instead of joining checkpoints with straight lines.
you write this one - 03join
Radio Tour
Puts timestamped commentary on the same clock as the positions, so events that are not in the numbers still land.
you write this one - 04calc
Gaps and groups
Turns a stream of coordinates into who is with whom, and by how much, at any moment.
you write this one - 05plot
Stage board
The view somebody who does not write R opens, drives, and reads without you in the room.
you write this one
The result is a no-code interface. Somebody who does not write R opens it, drives it, and reads it without you in the room. That is the part of the job description everybody claims and almost nobody can show.
Three problems, and every one of them is in your job too.
The stage board was built live against a real race. Nothing about the problems is specific to cycling.
The endpoint has no memory
The live feed returns one thing: where everybody is, right now. Ask it again a minute later and the previous answer is gone. Nothing is stored, nothing is queryable, and after the stage there is no history to go back to.
So you have to be the memory. A recorder polls it every thirty seconds for the whole afternoon and keeps all 526 answers. That fixed clock is what makes the race analyzable afterwards, and it is the part people skip.
The geometry lies
Join two GPS checkpoints with a straight line and the line goes through the hillside the riders went around. Every profile built that way is flatter than the road, and it is flattest exactly where the race is decided.
The riders are the survey. They went where the road went, so their own positions rebuild it. Eight categorized climbs and 2,675 meters of ascent only appear once the geometry comes from the peloton rather than from the map.
The event is not in the data
Two crashes and an abandon happened on that stage. Position data shows a rider drifting backwards and says nothing about why. The difference between losing a wheel and lying on the road is the entire story.
Radio Tour commentary carries it, so you timestamp it and join it onto the same clock as the positions. It is the least glamorous part of the build and it is worth more than the modeling.
Five blocks, wired, and a view at the end of them.
blockr is a visual framework: each block is a unit of work with typed inputs and outputs, and a board is blocks wired together. Once it is wired, somebody who does not write R can drive it.
Open the live appThe panel is our drawing of the board, not a capture of it. The live app is a research deployment and is currently not starting; the button opens it in a new tab in case it has come back. blockr itself is open source: blockr.site, the core repository, and blockr.assistant.
Four things, and all four are on job descriptions.
Write your own blocks
A block is a unit of work with typed inputs and outputs that somebody else can wire without reading your code. You write five in the session.
R package structure, S3, reactive contractsWire them into a board
Blocks connected into a working pipeline, with state that holds up when somebody clicks in an order you did not plan for.
Shiny modules, reactive graphs, statePut your own data behind it
The stage board is the worked example. You bring a source, connect it, and leave with the board reading yours.
Ingest, joins, refreshHand it to somebody who does not write R
The job description says communicate with non-technical stakeholders and usually means a slide. This is the other reading: a tool they drive themselves.
No-code interfaces, handover
Anyone who writes R and keeps getting asked for the same analysis again with different filters.
- You should be comfortable withwriting functions in R, and the idea of Shiny. You do not need to have built a package or a module before.
- Bringa laptop and a dataset you actually care about. A CSV is fine. The board you leave with should be reading your data, not ours.
- You do not needto install anything. The environment is provisioned and opens in a browser.
- Not for you ifyou have never written R, or you want a finished dashboard handed to you rather than built.
David Granjon
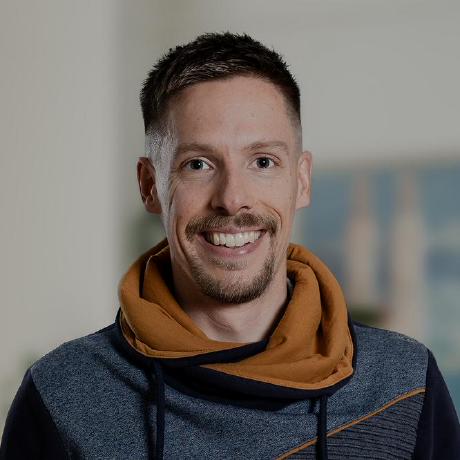
David Granjon, PhD
Lead Shiny developer at cynkra. Creator of shinyMobile.He wrote the blocks this workshop is built from and he teaches both sessions. The stage board is his build, run live against the race as it happened.
Read David's full writeup of the build. That account is his and cynkra's; everything on this page is our own description of what the workshop teaches.
 Run with cynkra. Logo used with permission.
Two sessions open, two dates held.
Each session is three hours, live, with the recording after. The December dates are held pending demand and are not on sale.
- Thursday September 24, 202614:00-17:00 CEST · 08:00-11:00 EDT · three hours (one of two)Open
- Thursday October 1, 202614:00-17:00 CEST · 08:00-11:00 EDT · three hours (one of two)Open
- Thursday December 3, 202614:00-17:00 CET · 08:00-11:00 EST · three hours (one of two)Date held
- Thursday December 10, 202614:00-17:00 CET · 08:00-11:00 EST · three hours (one of two)Date held
This cohort runs with eight or more registrations. If it does not fill, you are refunded in full.
Workshops are run and sold separately from the Masterclass.
Partner workshops are the only ones we run.
We retired the self-marketed catalog in July. Every workshop now runs with a partner who has the audience.
- You bring the roomA conference track, a user group, a team, a department. We have run these into audiences the partner already has, and that is the format that works: your people, our build.
- We bring the buildSix hours across two afternoons, live, with an instructor who does the work for a living rather than a trainer reading a deck. Materials, environment and recording are ours to organize.
- Terms are per dealThere is no standing rate card for partner workshops. Tell us the audience and the date and we will come back with a shape.
Six hours across two afternoons. You leave with the board running.
Bring an R project you are tired of rerunning by hand, and a dataset you care about. This cohort runs with eight or more registrations. If it does not fill, you are refunded in full.
Tell us you are interested
Registration opens shortly. Leave your details and we will email you first, before it goes out anywhere else.
One email when dates and details are set. Nothing else.