AthlyticZ · product builds

Launch your next sports analytics product.

We harness AI to build real sports products: apps, models and the systems behind them, designed and shipped end to end.

Book a 20-minute scoping call

Who are you building for?

Turn what you see into data your athletes act on.

01 Mobile app

A mobile app your athletes open every day.

Turn what you see into data your athletes act on.

Illustration built in code. Invented data.

9:415G
07
Athlete 07Midfield · Under 19
82Readiness
31.4Top speed km/h
412Load
7.6Sleep h

Today's session

  • Warm up12 min
  • Sprints, 6 x 30 m6 of 6
  • Strength block3 of 4 sets
  • Cool down8 min
ProfileSessionTrends

02 Web app

A web app your staff runs the week from.

Turn what you see into data your athletes act on.

Illustration built in code. Invented data.

app.yourclub.example/squad
SquadSessionsLoadReportsSettings
Squad load · Week 12Live
Available22 of 26
Average load438
High-speed distance6.2 km
Flags3
Acute and chronic load
Load by position group

GK

DEF

MID

FWD

Athlete 03DEF402On plan

Athlete 09MID517Above range

Athlete 14FWD534Above range

Athlete 21MID448On plan

Athlete 26GK291On plan

03 Model

A model built around the question you ask.

Turn what you see into data your athletes act on.

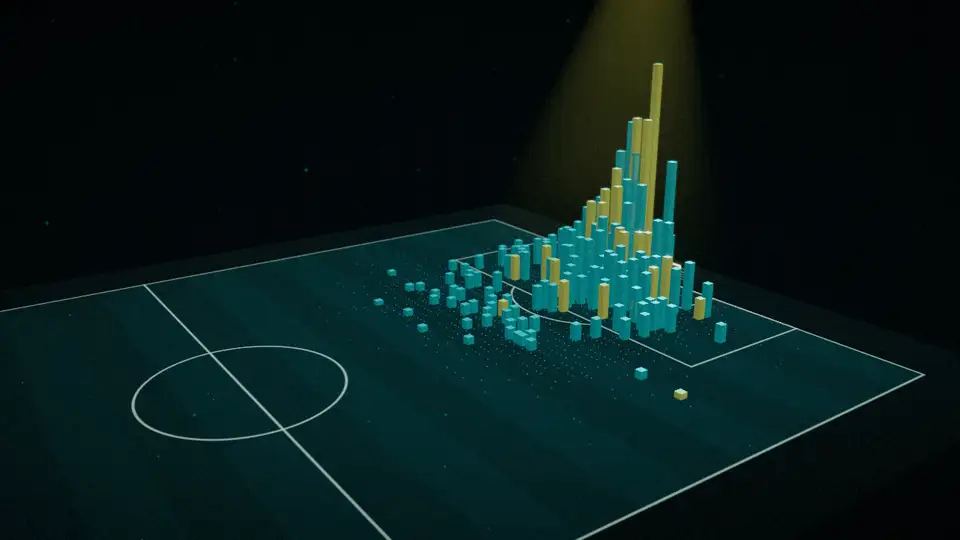
Shot data: Wyscout public match events, Pappalardo et al. (2019), CC BY 4.0. Arena scene: 2021-22 NBA regular season play-by-play, aggregated.

A three-dimensional surface over a soccer pitch that rises steeply in front of the goal
Expected goals surface
A soccer pitch with a cluster of teal and gold columns in the penalty area
One player's shots, each as tall as its chance
A model surface in teal and gold standing on the floor of an arena drawn in light
Win probability across a game

04 Computer vision

Computer vision that turns video into measurements.

Turn what you see into data your athletes act on.

Illustration built in code. Invented data.

Training clipTracked 725 frames a second

05 AI assistant

An AI assistant that answers from your own data.

Turn what you see into data your athletes act on.

Illustration built in code. Invented data.

AssistantConnected to your squad data

Who is carrying the most sprint load this week, and what should Thursday look like?

Three athletes are above their own four-week average for high-speed running: Athlete 09, Athlete 14 and Athlete 21. The chart shows this week against each athlete's average. For Thursday, consider capping their sprint volume and keeping the rest of the squad on plan.

High-speed running, this week and four-week average

03

07

09

14

21

26

Draft Thursday's planCompare with last month
Ask about your squad

How it holds up

Systems, not one-off dashboards.

  1. Data in

    Feeds load on a schedule and are checked on arrival, so a new season arrives as new rows.

  2. Models

    Each model is versioned and refit as results come in, so its numbers stay current.

  3. Product

    The app reads from the models, so an improved model reaches the screen with no redesign.

  4. Monitoring

    Checks run every day and raise a flag when a feed breaks or a model drifts.

How it works

Four steps from a call to a launch.

  1. 1

    Scoping call

    Twenty minutes on what you want to build and who will use it.

  2. 2

    A written blueprint

    Scope, timeline, team.

  3. 3

    Build in sprints

    A demo after each sprint, on your own data.

  4. 4

    Launch and support

    We ship it with you and stay on for what comes next.

Build with us

Scope your coaching product with us.

Tell us what you want to build, then pick a time for a 20-minute scoping call.

We call the number you give about this request, usually within the hour. By sending this you agree to receive email from AthlyticZ about your request. Unsubscribe any time.